Census
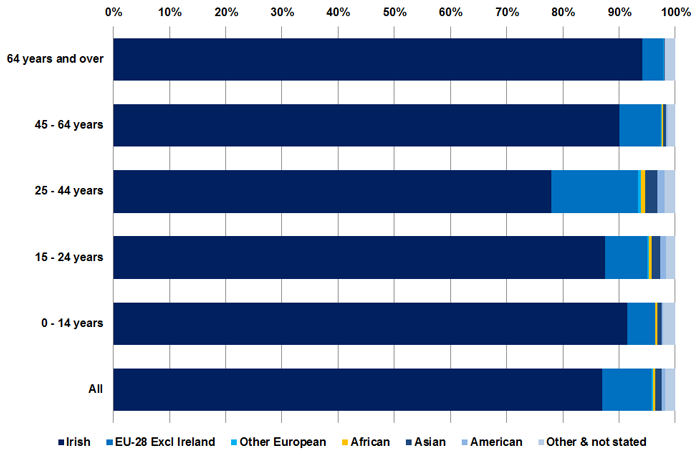
Number of people living in Ireland by Nationality and Age (2016)
Source: Census 2016 Profile 7 - Migration and Diversity
Population Usually Resident and Present in the State 2016 by Nationality and Age | |||||||||
---|---|---|---|---|---|---|---|---|---|
Age | Irish |
EU-28 Excl Ireland |
Other Europe | African | Asian | American |
Other nationalities & not stated |
All nationalities | |
All | 4,082,513 | 408,918 | 109,33 | 22,150 | 50,661 | 30,991 | 83,755 | 4,689,921 | |
0 - 14 years | 916,590 | 49,360 | 1,173 | 3,319 | 7,222 | 2,630 | 22,042 | 1,002,336 | |
15 - 24 years | 492,075 | 42,267 | 1,194 | 3,192 | 8,459 | 5,716 |
9,402 |
562,305 | |
25 - 44 years | 1,079,511 | 212,934 | 6,504 | 12,137 | 29,649 | 17,691 | 25,911 | 1,384,337 | |
45 - 64 years | 1,004,604 | 81,345 | 1,764 | 3,216 | 4,835 | 3,846 | 15,256 | 1,114,866 | |
64 years and over | 589,733 | 23,012 | 298 | 286 | 496 | 1,108 | 11,144 | 626,077 |
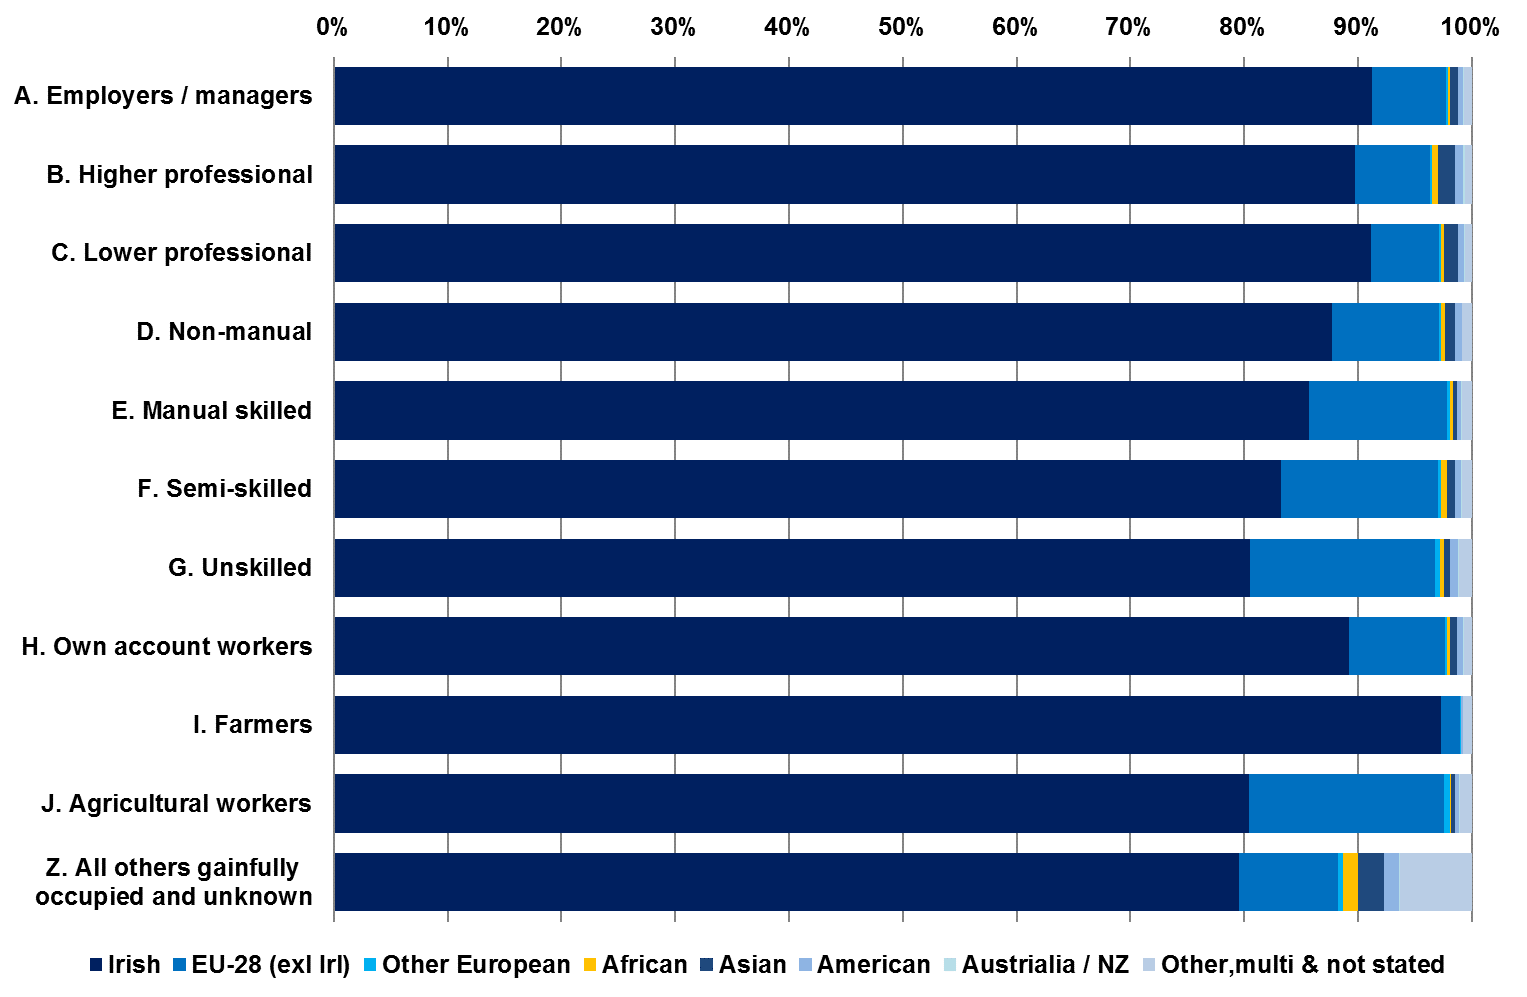
Number of people living in Ireland by Nationality and Socio Economic Group
Population Usually Resident and Present in the State 2016 by Socio Economic Group | |||||||||
Irish | EU-28 (exl Irl) | Other Europe | Africa | Asia | America | Australia / New Zealand | Other, multi-nationalities and not stated | Total | |
---|---|---|---|---|---|---|---|---|---|
All socio-economic groups | 4,082,513 | 408,918 | 10,933 | 22,150 | 50,661 | 30,991 | 3,524 | 80,231 | 4,689,921 |
A. Employers and managers | 663,023 | 47,455 | 1,307 | 1,321 | 4,713 | 3,395 | 716 | 4,855 | 726,785 |
B. Higher professional | 298,373 | 21,801 | 709 | 1,587 | 5,087 | 2,388 | 446 | 2,015 | 332,406 |
C. Lower professional | 560,435 | 36,599 | 1,105 | 1,631 | 7,330 | 3,370 | 589 | 3,769 | 614,828 |
D. Non-manual | 866,176 | 93,435 | 1,832 | 3,118 | 8,483 | 6,036 | 699 | 8,176 | 987,955 |
E. Manual skilled | 305,904 | 43,491 | 902 | 721 | 1,299 | 1,291 | 213 | 3,236 | 357,057 |
F. Semi-skilled | 305,910 | 50,604 | 936 | 2,014 | 2,803 | 1,814 | 178 | 3,309 | 367,568 |
G. Unskilled | 123,061 | 24,903 | 604 | 542 | 891 | 1,061 | 48 | 1,792 | 152,902 |
H. Own account workers | 158,426 | 14,878 | 331 | 529 | 1,074 | 881 | 183 | 1,263 | 177,565 |
I. Farmers | 149,518 | 2,605 | 42 | 31 | 85 | 194 | 43 | 1,171 | 153,689 |
J. Agricultural workers | 18,408 | 3,915 | 112 | 25 | 76 | 84 | 17 | 245 | 22,882 |
Z. All others gainfully occupied and unknown | 633,279 | 69,232 | 3,053 | 10,631 | 18,507 | 10,477 | 392 | 50,400 | 795,971 |
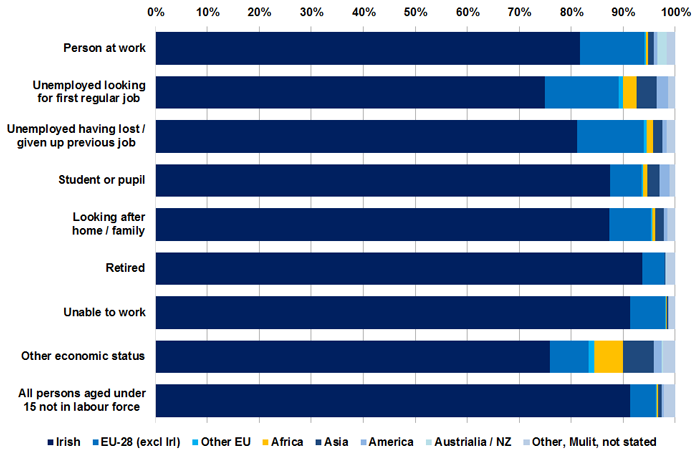
Number of people living in Ireland by Nationality and Principal Economic Status
Population Usually Resident and Present in the State 2016 by Principal Economic Status |
|||||||||
Irish | EU-28 (excl Irl) | Other Europe | Africa | Asia | America | Australia / New Zealand | Other, multi-nationalities & not stated | Total | |
All | 4,082,513 | 408,918 | 10,933 | 22,150 | 50,661 | 30,991 | 3,524 | 80,231 | 4,740,582 |
Person at work | 1,647,596 | 251,438 | 5,771 | 7,668 | 21,676 | 14,269 | 35,749 | 33,668 | 2,017,835 |
Unemployed looking for first regular job | 23,060 | 4,339 | 254 | 830 | 1,170 | 679 | 22 | 408 | 30,762 |
Unemployed having lost or given up previous job | 213,697 | 33,769 | 1,226 | 3,457 | 4,677 | 2,052 | 170 | 4,196 | 263,244 |
Student or pupil | 363,296 | 25,360 | 926 | 3,892 | 9,488 | 7,779 | 185 | 4,629 | 415,555 |
Looking after home/family | 264,672 | 24,250 | 958 | 1,641 | 4,781 | 1,994 | 304 | 4,434 | 303,034 |
Retired | 498,919 | 22,137 | 265 | 229 | 470 | 1,090 | 116 | 9,158 | 532,384 |
Unable to work | 143,938 | 10,647 | 207 | 342 | 334 | 271 | 41 | 1,938 | 157,718 |
Other economic status | 10,745 | 1,057 | 153 | 772 | 843 | 227 | 23 | 340 | 14,160 |
All persons aged under 15 years not in labour force | 916,590 | 49,360 | 1,173 | 3,319 | 7,222 | 3,568 | 582 | 21,460 | 1,003,274 |
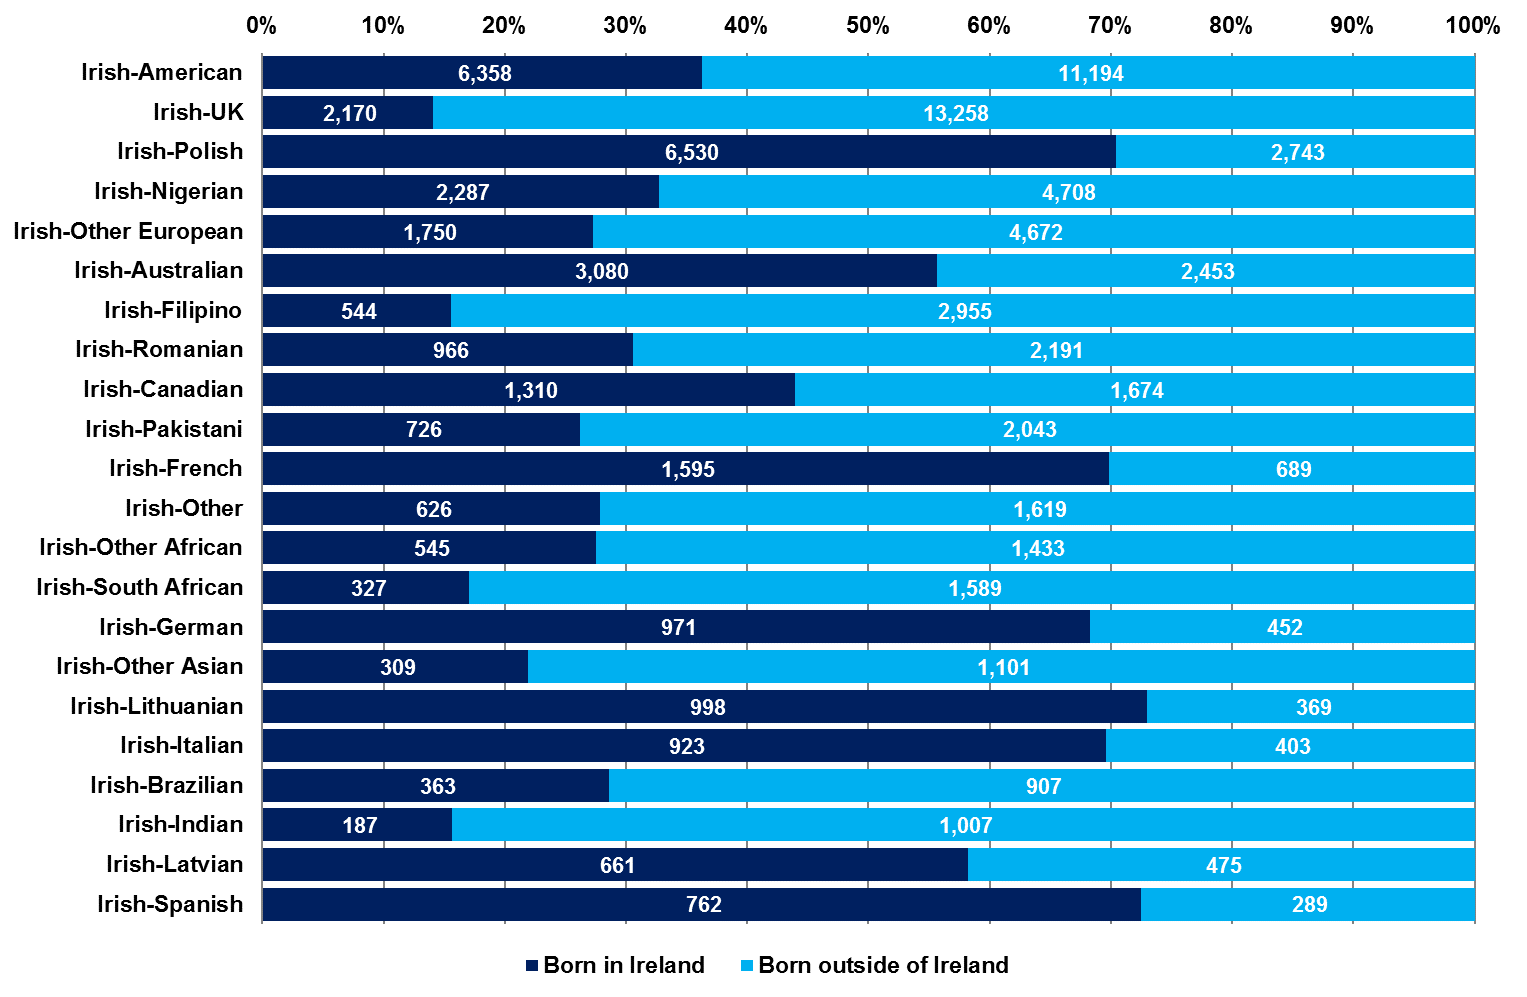
Dual Irish nationalities with which 1000 or more persons identified
Dual Irish nationalities with which 1000 or more persons identified | |||
Dual-nationality | Born in Ireland | Born in Abroad | Total |
---|---|---|---|
Irish-American | 6,358 | 11,194 | 17,552 |
Irish-UK | 2,170 | 13,258 | 15,428 |
Irish-Polish | 6,530 | 2,743 | 9,273 |
Irish-Nigerian | 2,287 | 4,708 | 6,995 |
Irish-Other European | 1,750 | 4,672 | 6,422 |
Irish-Australian | 3,080 | 2,453 | 5,533 |
Irish-Filipino | 544 | 2,955 | 3,499 |
Irish-Romanian | 966 | 2,191 | 3,157 |
Irish-Canadian | 1,310 | 1,674 | 2,984 |
Irish-Pakistani | 726 | 2,043 | 2,769 |
Irish-French | 1,595 | 689 | 2,284 |
Irish-Other | 626 | 1,619 | 2,245 |
Irish-Other African | 545 | 1,433 | 1,978 |
Irish-South African | 327 | 1,589 | 1,916 |
Irish-German | 971 | 452 | 1,423 |
Irish-Other Asian | 309 | 1,101 | 1,410 |
Irish-Lithuanian | 998 | 369 | 1,367 |
Irish-Italian | 923 | 403 | 1,326 |
Irish-Brazilian | 363 | 907 | 1,270 |
Irish-Indian | 187 | 1,007 | 1,194 |
Irish-Latvian | 661 | 475 | 1,136 |
Irish-Spanish | 762 | 289 | 1,051 |